Tuesday, April 11, 2017

Afro-American and Native American Shared R1 Y-Chromosomes

There are a number of Y-chromosome Haplogroups shared by mongoloid Native Americas and Afro-Americans.


I can not find any information on V88 among Afro-Americans. But I have found information on the frequency of haplogroup R among Afro-Americans.

.
 -

.
Haplogroup E-P1 is called E1b1a1 .In the Hammer et al (2006) study while 63% of Afro-Americans carry this haplogroup,1.3% Native Americans carry the same haplogroup. 
.
 -

.
The second most frequent Y-chromosome among Afro-Americans is R1b. In the Vallone and Butler (2004) study AAs carried around 0.3% R-M207, and 23% R1b.
.
 -
.
Miller et al (2006) did a detailed study of Afro-American and Native American Y-Chromosome. Miller et al (2006) revealed that NA and AAs share many R haplogroups including R-M17 and R-M207. It is interesting to note that in relation to R-M269, that 21% carried this haplogroup, while 17.0 of AAs carried the same haplogroup. This is interesting because there is very little statistical difference between 17% and 21%.

Sunday, April 9, 2017

Why We Find Discrepancies in African and Non-African Admixture/Structure Studies

We may never know the admixture between Native Americans and Africans if we wait to get the information from researchers because they are attempting to maintain the status quo.

Discrepancies take place because researchers do not want to tell the truth about the genetic histories of African people and their admixture with Native Americans and Eurasians. As a result, researchers have developed methods to exclude evidence of non-Africans carrying haplogroups mtDNA haplogroups L, and y-Chromosomes E and A.


This is due to the protocols of AdMixture and Structure programs that assume that Native Americans, Europeans and Africans only met after 1492. As a result researchers try to find methods to exclude African presence in European and Native Americans so evidence of this admixture will not be evidenced in the final results. Next researchers claim that if African people carry mtDNA haplogroups: N, R, M and D ; and Y-Chromosomes C, Q, I, J, and R, they are carrying Eurasians haplogroups, eventhough all of these haplogroups are found among African populations that have no history of admixture with Europeans. As a result, these haplogroups are probably of African origin--not a back migration.

Researchers believe this evidence should be excluded because any African admixture among these populations have to be recent.
The best example of how African admixture is excluded in research is Reich, D. et al, Reconstructing Native American population history. Nature 488, 370-374 (2012) Paper web page , the method used to exclude African admixture from this study is detailed in Supplementary Material 1.Reich, D. et al (2012) outlines the motivations for the exclusion of Africans from his study:

quote:
  • (i) Motivation
    There were a number of populations for which we did not have access to unadmixed samples. To learn about the history of such populations, we needed to adjust for the presence of non-Native ancestry. We used three complementary approaches to do this. The concordance of results from all these approaches increases our confidence in the key findings of this study.

    (1) Restricting to unadmixed samples: We restricted some analyses to 163 Native American samples (34 populations) without any evidence of recent European or African admixture (Note S2). A limitation of these studies, however, is that we could not analyze 16 populations in which all individuals were inferred to have some degree of recent admixture.

    (2) Local ancestry masking: We identified segments of the genome in each individual that had an appreciable probability of harboring non-Native American or Siberian ancestry. We then created a “masked” dataset that treated genetic data in these sections as missing (Note S4).

    (3) Ancestry Subtraction: We explicitly corrected for the effect of the estimated proportion of European and African in each sample by adjusting the value of f4-statistics by the amount that is expected from this admixture. This is discussed in what follows.

    (ii) Details of Ancestry Subtraction
    Assume that we have an accurate estimate of African and European ancestry for each sample (whether it is an individual or a pool of individuals). In practice, we used the ADMIXTURE k=4 estimates, because as described below, they appear to be accurate for Native American populations (with the possible exception of Aleuts as we discuss below). We can then define:

    a = % African ancestry in a test sample
    e = % European ancestry in a test sample
    1-a-e = % Native ancestry

    For many of our analyses, we are computing f4 statistics, whose values are affected in a known way by European and African admixture. Thus, we can algebraically correct for the effect of recent European or African admixture on the test statistics, obtaining an “Ancestry Subtracted” statistic that is what is expected for the sample if it had no recent European or African ancestry.

    The main context in which we compute f4 statistics is in our implementation of the 4 Population Test, to evaluate whether the allele frequency correlation patterns in the data are consistent with the proposed tree ((Unadmixed, Test),(Outgroup1, Outgroup2)), where the Unadmixed population is a set of Native American samples assumed to derive all of their ancestry from the initial population that peopled America, the Test population is another Native American population, and the two outgroups are Asian populations. An f4 statistic consistent with zero suggests that the Unadmixed and Test populations form a clade with no evidence of ancestry from more recent streams of gene flow from Asia. If the Test population harbors recent European or African ancestry, however, a significant deviation of this statistic from zero would be expected, making it difficult to interpret the results. We thus compute a linear combination of f4 statistics that is expected to equal what we would obtain if we had access to the Native American ancestors of the Test population without recent European or African admixture:

    S_1=(f_4 (Unadmixed,Test;Out1,Out2)-(a) f_4 (Unadmixed,Yoruba;Out1,Out2)-(e) f_4 (Unadmixed,French;Out1,Out2))/(1-a-e) (S3.1)

    Intuitively, this statistic is subtracting the contribution to the f4 statistic that is expected from their proportion a of West African-like ancestry (Yoruba), and their proportion e of West Eurasian-like ancestry (French). We then renormalize by 1/(1-a-e) to obtain the statistic that would be expected if the sample was unadmixed.

    A potential concern is that the African and European ancestry in any real Native American test sample is not likely to be from Yoruba and French exactly; instead, it will be from related populations. However, S1 is still expected to have the value we wish to compute if we choose the outgroups to be East Asians or Siberians. The reason is that genetic differences between Yoruba and the true African ancestors, and French and the true European ancestors, are not expected to be correlated to the frequency differences between two East Asian or Siberian outgroups. Specifically, the allele frequency differences are due to history within Africa or Europe, which is not expected to be correlated to allele frequency differences within East Asia and within Siberia.

    (iii) Ancestry Subtraction gives results concordant with those on unadmixed samples
    To compare the performance of our three approaches to address the confounder of recent European and African admixture, we computed 48 = 8×6 statistics of the form f4(Unadmixed, Test; Han, San). We choose “Unadmixed” to be one of 8 Native American groups from Meso-America southward that have sample sizes of at least two and for which all samples are inferred to be unadmixed by ADMIXTURE k=4 (Chane, Embera, Guahibo, Guaymi, Karitiana, Kogi, Surui and Waunana). We choose “Test” to be one of 8 Native American populations from Meso-America southward with at least two samples that are entirely unadmixed, and that also have at least two samples that have >5% non-Native admixture according to the ADMIXTURE k=4 analysis (Aymara, Cabecar, Pima, Tepehuano, Wayuu and Zapotec1). This allows us to compare results on admixed and unadmixed samples from the same population.

    If the Test population harbors European or West African admixture that we have not corrected, we expect to see a significant deviation of the statistic from zero. For example, f4(Karitiana, French; Han, San), corresponding to the statistic expected for an entirely European-admixed Native American population, is significant at Z = 45 standard errors from zero, and f4(Karitiana, Yoruba; Han, San), which gives the f4-value we would expect for an entirely West African-admixed Native American population, is significant at Z = 101.

    Figure S3.1 shows the scatterplots of Z-scores we obtain without Ancestry Subtraction, with Ancestry Subtraction, and with local ancestry masking (Note S4). The x-axis shows data for the unadmixed samples from each Test population, while the y-axis shows the results for the >5% admixed samples from the same populations. We find that:
    • Without Ancestry Subtraction there are significant deviations from zero (|Z|>3) (Fig. S3.1A)
    • With Ancestry Subtraction, there are no residual |Z|-scores >3 (Figure S3.1B)
    • With local ancestry masking (Note S4), there are again no residual |Z|-scores >3 (Figure S3.1C), showing that this method also appears to be appropriately correcting for the admixture.


Given the exclusion of Africans from studies like Reich, D. et al (2012), means that we are not really knowing the actual admixture among Africans and Native American that carry the accepted African haplogroups: i.e., haploroups E , L and etc.

Tuesday, April 4, 2017

The Basal Europeans were probably Sub-Saharan Africans


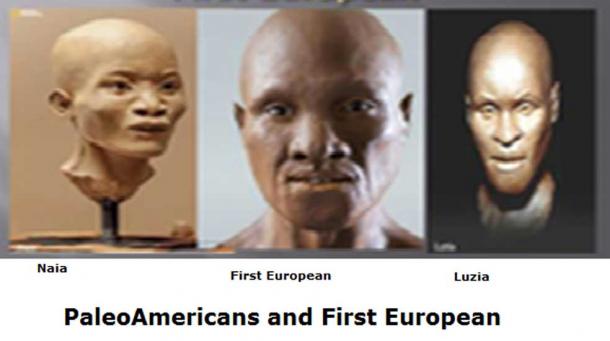
It has always been know that the first hunter-gatherers of Europe were  SSAs (Sub-Saharan Africans) . Now we can declare that the carriers of haplogroup R1, that introduced the European agro-pastoral cultures to Europe, i.e., Bell Beaker and Yamnaya were probably also SSAs because they carried V88.

This should not be surprising according to Turek,  the Bell Beaker culture probably began in Morocco. Neolithic migrants into Europe from the Levant were also SSA. Trenton W. Holliday, tested the hypothesis that if modern Africans had dispersed into the Levant from Africa, "tropically adapted hominids" would be represented in the archaeological history of the Levant, especially in relation to the Qafzeh-Skhul hominids.  This researcher found that the Qafzeh-Skhul hominids (20,000-10,000),were assigned to the Sub-Saharan population, along with the  Natufians samples (4000 BP). Holliday also found African fauna in the area. If they were Sub-Saharan Africans in the Levant.


Toomas Kivisild1 (2017).The study of human Y chromosome variation through ancient DNA. web page provides a detailed discussion of R1 in prehistoric Europe.

The article is interesting. It is most interesting because it places V88 in ancient Europe. It is sad that researchers fail to publish this reality.


Kivisild (2017) also made it clear that V88 is the earliest offshoot of R-M343 .
quote:


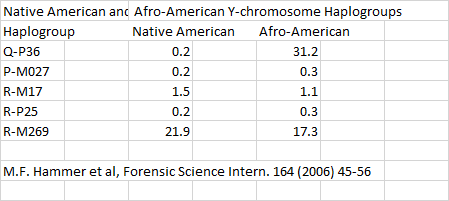
Late Neolithic, Early Bronze Age and Iron Age samples from Central and Western Europe have typically the R1b-L11, R1a1-Z283 and R1a-M417 (xZ645)
affiliation while the samples from the Yamnaya and Samara neighbourhood are different and belong to sub-clades R1b11-Z2105 and R1a2-Z93 (Allentoft et al. 2015; Cassidy et al. 2016; Haak et al. 2015; Mathieson et al. 2015; Schiffels et al. 2016).


 -


The R1b11-Z2015 lineage is today common in the Caucasus and Volga-Uralic region while being virtually absent in Central and Western Europe (Broushaki et al.2016). Interestingly, the earliest offshoot of extant haplogroup R1b-M343 variation, the V88 subclade, which is currently most common in Fulani speaking populations in Africa (Cruciani et al. 2010) has distant relatives in Early Neolithic samples from across wide geographic area from Iberia, Germany to Samara (Fig. 7).


The presence of the carriers of V88 in Europe makes it clear that Sub-Saharan Africans had been in Europe for an extended period of time. Moreover it is clear that 25kya SSAs carrying haplogroup R1 were in Eurasia, Africa and the Americas.
.

 -

The Basal Eurasians that are mixed into modern Europeans, who came from the Middle East, and North Africa were SSA's not Indo-European speakers.
.


quote:


Interestingly, the earliest offshoot of extant haplogroup R1b-M343 variation, the V88 sub-clade, which is currently most common in Fulani speaking populations in Africa (Cruciani et al. 2010) has distant relatives in Early Neolithic samples from across wide geographic area from Iberia, Germany to Samara (Fig. 7).


This quote makes it clear the V88 sub-clade, had relatives in Early Neolithic samples from across wide geographic area from Iberia, Germany to Samara. This would place carriers of V88 among the Yamnaya and Bell Beaker people. Given the wide distribution of M269 in Africa, the carriers of this haplogroup were probably also Africans since the Bell Beaker people/culture originated in Morocco as noted by Turek (2012) and the Neolithic people of the Levant were also SSA  as proven by Holliday (2000). 

Reference:

Holiday, T. (2000). Evolution at the Crossroads: Modern Human Emergence in Western Asia, American Anthropologist,102(1) .

Turek, J. 2012: Chapter 8 - Origin of the Bell Beaker phenomenon. The Moroccan connection, In: Fokkens, H. & F. Nicolis (eds) 2012: Background to Beakers. Inquiries into regional cultural backgrounds of the Bell Beaker complex. Leiden: Sidestone Press. https://www.academia.edu/1988928/Turek_J._2012_Chapter_8_-_Origin_of_the_Bell_Beaker_phenomenon._The_Moroccan_connection_In_Fokkens_H._and_F._Nicolis_eds_2012_Background_to_Beakers ._Inquiries_into_regional_cultural_backgrounds_of_the_Bell_Beaker_complex._Leiden_Sidestone_Press